Note: There is an inconsistency in the literature on reporting high sensitivity C-Reactive Protein levels.
The actual protein is properly abbreviated CRP.
The test procedure for measuring quantities below 10 mg/L is hsCRP.
This ad-free article is made possible by the financial support of the
Center for Research on Environmental Chemicals in Humans: a 501(c)(3) non-profit.
Please consider making a tax-deductible donation for continued biomedical research.
However, published papers most often refer to the protein as hsCRP which is, technically, incorrect because that is the test, not the protein.
Because most papers use hsCRP consistently to refer to the protein, Investigators have followed the inaccurate terminology and done that as well even though it seems like a foolish consistency.
Stealth Syndromes Human Study – Follow-up thoughts and questions
The hsCRP readings at the end of the trial were not what was expected. On the other hand, real science often starts when the results are not as anticipated.
The following is a quick summary of findings and possible considerations and roots of the unexpected results. Citations are available.
Note that the analysis of concentrations of BPA and other chemicals in the panel are not yet available.
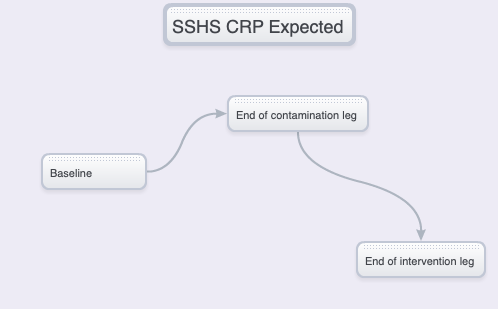
Initial expectations
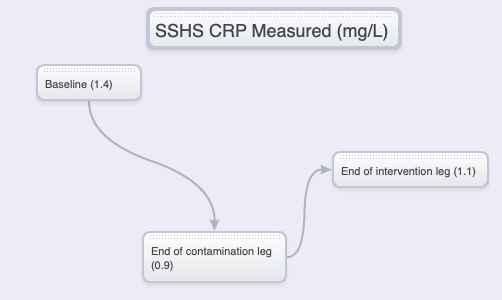
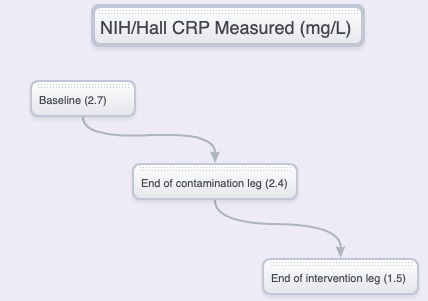
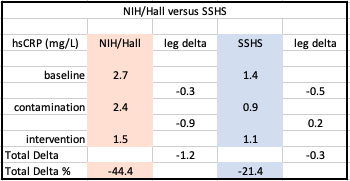
NIH/HALL vs SSHS – CONCENTRATIONS, DELTAS
The NIH/Hall study
- BPA and phthalates exercise effects on those proteins in a similar manner as illustrated in the Hall study.
- Ultra-processed foods are also higher in BPA and phthalates due to the extensive use of plastics in processing and packaging.
- Failure to provide recipes (formula), sourcing of materials, preparation, description of equipment, materials including relevant food contact materials.
- Failure to note whether food preferences of test subjects were taken into account.
- Failure to take into account that ad libitum food consumption will depend on food preferences (or aversions) as well as seasoning, preparation method or time.
What’s going on? A look at the baseline versus “unhealthy” trial leg hsCRP anomaly
The Kincade Fire in northern Sonoma County started on October 23, 2019, was contained on Nov. 6 but continued to burn and affect the test location during and after the SSHS study was finished.
Because PM 2.5 is a potent inflammatory agent, a monitoring device was purchased to track indoor air quality and activated the day before the first (baseline) blood draw.
In retrospect, activities probably should have been restricted before the baseline draw.
However, a literature search has not found a reference dealing with the pharmacokinetics of PM 2.5. It is, at this point, unknown how long a pre-baseline isolation period would need to be for an unconfounded valid baseline.
Accordingly, outdoor activity was limited during the trial because of wildfire smoke pollution.
In addition, a new HVAC filter was installed and two stand-alone HEPA air purifiers employed at the trial location to keep indoor air below 10 ppb even when outdoor air was consistently unhealthy at 70 to 100 ppb and occasionally exceeding 150 ppb.
Because outdoor activities were not restricted before the trial, the baseline hsCRP was probably affected, contributing to an unhealthy baseline measurement.
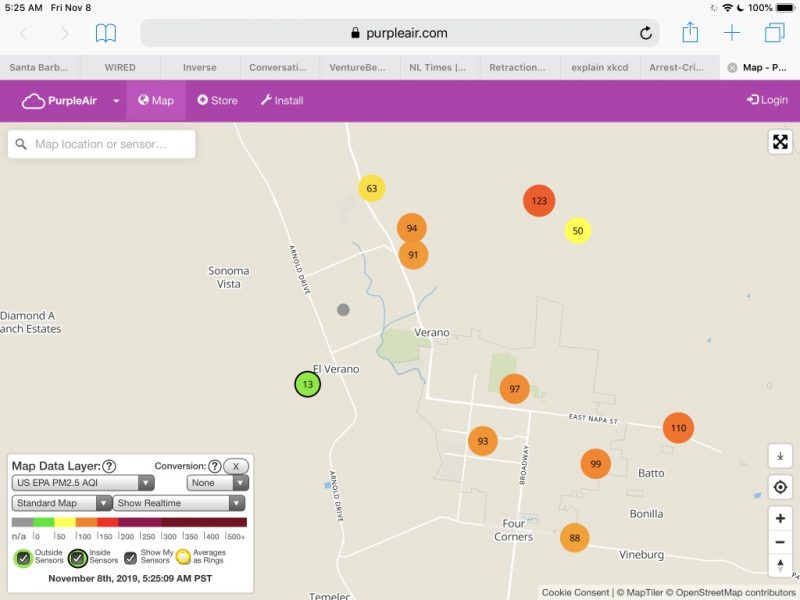
Indoor air quality at the test site was constantly monitored. Multiple HEPA air purifiers assured that indoor quality was maintained at a healthy level which was most often below 5 ppb.
In addition, the air was extremely unhealthy on the North coast on Nov. 8: the date of the first blood draw and the first day of the “Typical” diet. Significant to the PM 2.5 exposure is that the blood sample for BPA and other toxics testing needed to be delivered to the lab at UCSF Mt. Zion within four hours of the draw.
Because the test subject and investigator were the same person, that means that the scientist/lab rat had to be exposed to extremely unhealthy PM 2.5 for at least 3 hours including the commute into San Francisco and the deliveries of blood samples to the lab and the hsCRP sample to the lab at the Parnassus campus.
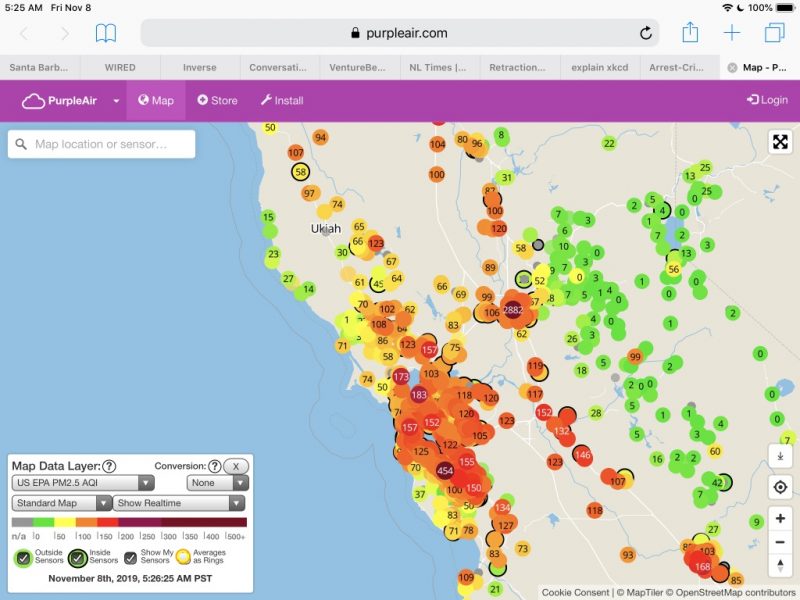
More air quality snapshots are available at: Air quality exposure may have confounded results.
Restriction of outdoor exercise meant forgoing regular exercise such as jogging. The lack of that exercise and the effect of being “trapped” had a noticeable effect on SSHS subject psychological stress.
- Home, & Office — cooking, vinyl flooring, wall coverings, upholstery, and other plastic-based products, pet dander, printer toner.
- External – Smog, wildfires.
NIH advantages
The NIH study subjects transitioned from a variety of home and external conditions into a consistent, controlled environment for 28 days in which stress and environmental factors which may have resulted in overall net-reductions in stress. Some new stress was undoubtedly introduced because the subjects were in an unfamiliar environment and subject to frequent scrutiny as well as periodic examinations and blood tests.
On the other hand, test subjects were housed in a comfortable dormitory setting free of many everyday demands — work, food preparation, washing dishes, household chores shopping etc. They were allowed time for monitored exercise and received additional attention and personal care.
It can only be conjectured that, in the NIH/Hall study, a decrease in psychological stress and a possibly less-healthy baseline diet, could be implicated in the hsCRP decrease following the contamination leg, and possibly in the overall greater percentage in hsCRP level decrease following the intervention leg.
In addition, NIH trial’s longer duration allowed other physiological and biological processes that may affect inflammation to reach equilibrium. Those include gut (and other microbiomes), hormone fluctuations, and potential epigenetic effects.
SSHS pre-baseline and continued psychological stress
SSHA’s test subject psychological stress was elevated due to a series of potential and actual PG&E power shutoffs related to red flag fire warnings and the Kincade Fire. That wildfire caused both delays and, in late October, required the disposal of substantial amounts of freshly prepared intervention foods which — without preservatives and constant refrigeration — spoiled.
All food preparation and sourcing prior to the start of the trial was concentrated on foods for the study, the actual food consumed by the SSHA test subject in the pre-baseline period. As a result, the food sourcing and preparation period was time-constrained, mainly pre-prepared grocery and fast-food meals. This made the immediate pre-baseline diet less healthy than usual.
That stress continued throughout the six-day trial as the SSHS test subject — with the help of two extraordinary culinary cooks and bakers — rushed to complete the study in advance of new, pending power shutoff warnings from PG&E.
Two powerful weaknesses in SSHS
The length of time — six days — may not have been adequate to allow hsCRP levels to reach equilibrium.
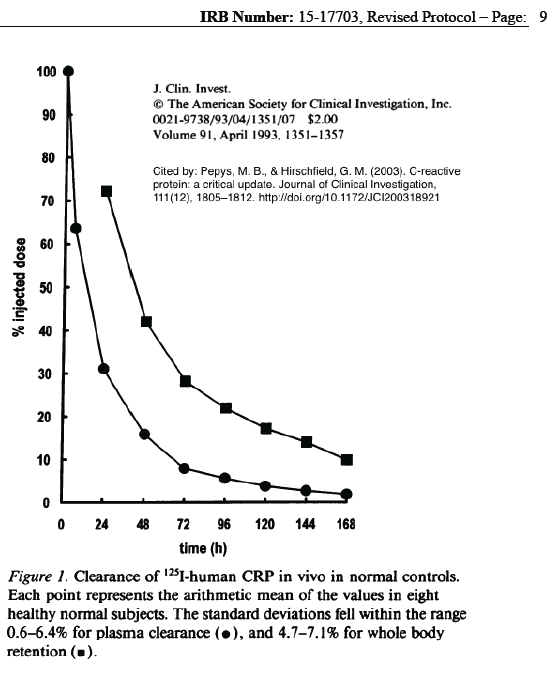
While the pharmacokinetics of hsCRP shows that it is rapidly metabolized, homeostatic mechanisms may have resulted in slower overall changes in body concentrations and lower measured levels after the intervention. The author of this summary does not yet have adequate data to assess that concept.
In addition to the study time period, an n=1 study has no way to detect outliers whose body chemistry may differ from the average study subject.
The 28-person cohort and 28-day extent of the NIH/Hall study offers a great advantage.
Indeed, if the NIH/Hall study had added a BPA environmental chemical panel to their study, it would have added a great deal of information.
Interesting Unknown Pharmacokinetics:
- How long does it take for PM2.5 to raise hsCRP and produce inflammation? How long does it take to dissipate?
- How quickly does psychological stress raise cortisol levels? How quickly do cortisol levels decrease?
- How quickly does increased cortisol begin to increase hsCRP? How quickly does hsCRP decrease as cortisol decreases?