
The chart on the left was published October 27, 2020 in MedRxiv: as Investigating hsCRP as a clinical inflammation marker for human Bisphenol A food contamination offers protocol suggestions for conducting replicable, causal dietary intervention studies ().
By contrast, the chart on the right, from September 2021 mass spec data, revealed scant evidence of BPA and substantial presence of BPA chemical structure analogues BPF and BPS.
These issues confirm the original study’s recommendations including the need for dosing, and dormitory environment to improve dietary intervention study replicability, and determination of causality.
A brief summary of how we got here (And why it has taken so long )
After The Nov. 25, 2015 approval of the study by the University of California San Francisco School of Medicine (UCSF) IRB/Committee on Human Research, the Parnassus campus pathology lab at UCSF Medical Center agreed to analyze blood samples of hsCRP. Following that, a qualified UCSF research lab agreed to perform serum analysis.
This ad-free article is made possible by the financial support of the
Center for Research on Environmental Chemicals in Humans: a 501(c)(3) non-profit.
Please consider making a tax-deductible donation for continued biomedical research.
The time to conduct the trial was extended on Oct. 27, 2019 because of delays caused by a fundamental re-examination of food sourcing requirements in order to facilitate replicability.
The head of the UCSF research lab provided blood draw “vacutainer kits” which the lab had validated as being free of leaching BPA and other plastic-derived chemicals.
While it would be less expensive to use urinalysis. that method measures the glucuronide metabolized form of BPA, I was hoping to compare ratios of free BPA (serum) with BPA-glucuronide. While measuring free BPA in human serum was difficult in the early 2000-teens, reliable LC/MS methods have been developed to surmount early obstacles
The ratio of free/metabolized BPA levels compared with hsCRP inflammation indicators would have been further instructional given recent research that indicate that BPA-glucuronide may be more harmful in the human body than free BPA.
Selected citations for this and other sections are included in (Citations, Appendix 2)at the end of this document.
In the run-up to the trial, I exchanged multiple emails with the Silent Spring Institute who had a program — Detox Me Action Kit that accepted urine samples from the public and researchers.
Those discussions dragged on and in early October 2019 — just weeks before the trial was to begin — the SSI responded that they were too busy and would not accept our samples.
The trial began in late October 2019 but had to be interrupted by continuing intermittent power outages from the Kincade Fire which was the largest of that year’s California wildfire season. The trial was restarted in early December.
Accordingly, test subject blood was drawn by the pathology lab of a UCSF affiliate hospital — Sonoma Valley Hospital —and delivered to the UCSF research lab and to the Parnassus campus hospital lab within an hour of draw as specified by the head of the UCSF research for BPA analysis.
In January 2020, investigators inquired about the UCSF research lab’s progress on analyzing the blood samples. The head of the lab then said he would not be processing the samples as previously agreed. The lab agreed to preserve the samples at -80C and hold them for our removal. With significant information from the hsCRP data, but lacking BPA data, investigators decided to begin working on a paper based on the incomplete data which had been captured.
What have we learned?
As noted in the MedRxiv study, even without BPA data, the results approximately replicated a larger, NIH-sponsored published trial. That trial did not measure any specific chemical biomarker compounds suspected of influencing biological processes, but used the NOVA system that provides a broad, generic distinction between processed and ultra-processed foods
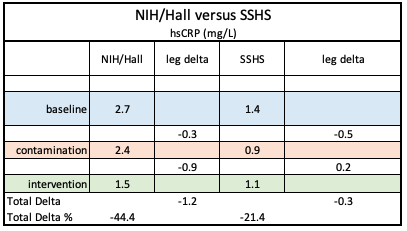
Unfortunately, the lack of serum analysis was a major omission in the paper, so after the MedRxiv digital publication on October 27, 2020, a search was launched for a new lab to process the serum BPA samples with the goal of editing that publication or creating a follow-up paper..
The search dragged on because there are not many labs qualified to perform mass spectrometry analysis on BPA/human serum. However, in mid-May 2021 the Linus Pauling Institute at Oregon State University agreed to perform mass spec analysis on the samples .
Elaborate preparations were made to maintain the sample cold chain from UCSF to Corvallis and where they were delivered on May 13, 2021.
Another delay followed because BPA analysis of human blood requires an extreme degree of precision, the Linus Pauling Institute required its mass spec devices to be cleaned by manufacturer representatives followed by re-calibration.
The Director of the Linus Pauling lab analyzed the blood samples using ultrahigh pressure liquid chromatography-tandem mass spectrometry using a triple quadrupole Shimadzu mass spectrometer which allows the study of the presence of other chemical compounds.
Puzzling results
The results, delivered on September 24, 2012 unexpectedly revealed BPA concentrations that were beneath the LOQ (Limit of Quantification).
The lab also analyzed the serum extracts using a high resolution quadrupole time-of-flight mass spectrometer using untargeted scanning for BPA, BPF and BPS which may be studied for the presence of other compounds.
As evidenced by comparing initial results with those from the Linus Pauling Institute (below), the comparison with NIH/Hall are consistent while, the mass spectrometry results contain multiple anomalies.
 By contrast, the chart on the right revealed scant evidence of BPA and substantial presence of BPA chemical structure analogues BPF and BPS.
Multiple Anomalies in Mass Spec results
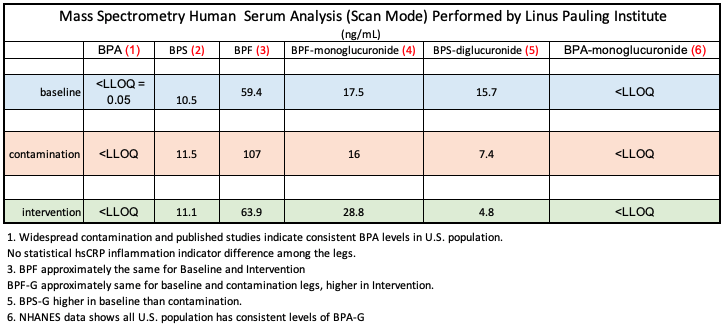
The anomalous Mass Spec concentration ratios among indicate that product manufacturers have substituted analogues for BPA. This may be an effort for manufacturers to make marketing claims that items are “BPA free.” Evidence, however, exists to indicate that the analogues are not less harmful than BPA, and may actually be more harmful. (see citations)
While not a chronological study, this paper: “Determination of trace levels of eleven bisphenol A analogues in human blood serum” confirms the widespread use of BPA and 10 analogues
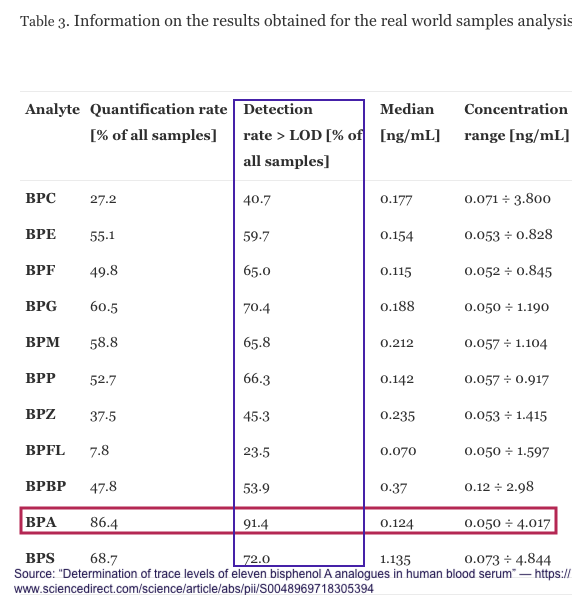
BPA and analogues over time
Published journal reports of BPA levels over time tend to be sporadic, inconsistent, and measured by a variety of methods which makes it difficult to impossible to credibly determine variations.
One credible study — Urinary Concentrations of Bisphenol A and Three Other Bisphenols in Convenience Samples of U.S. Adults during 2000–2014 — indicates the temporal substitution of analogues for BPA
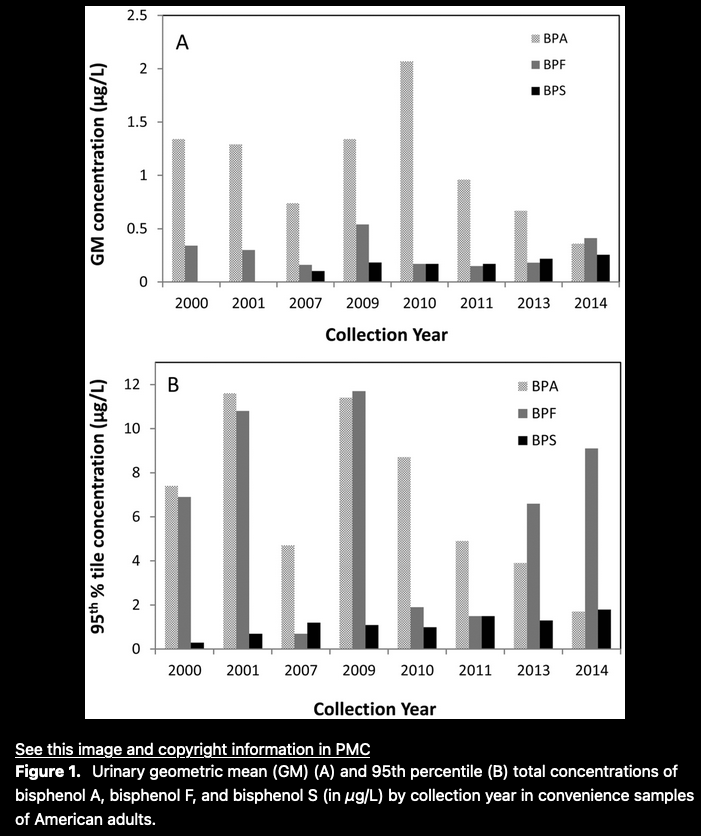
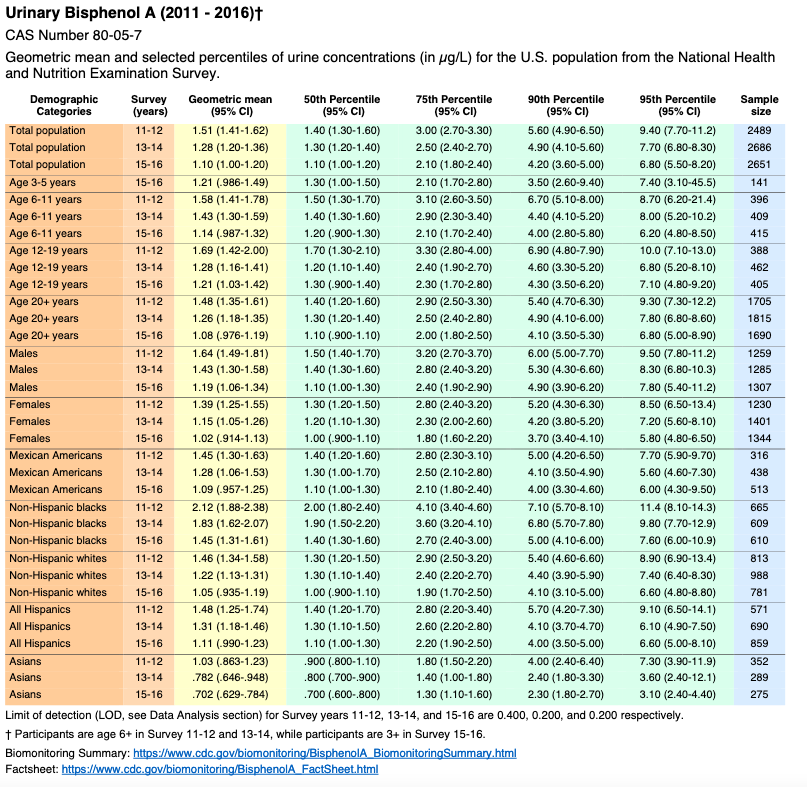
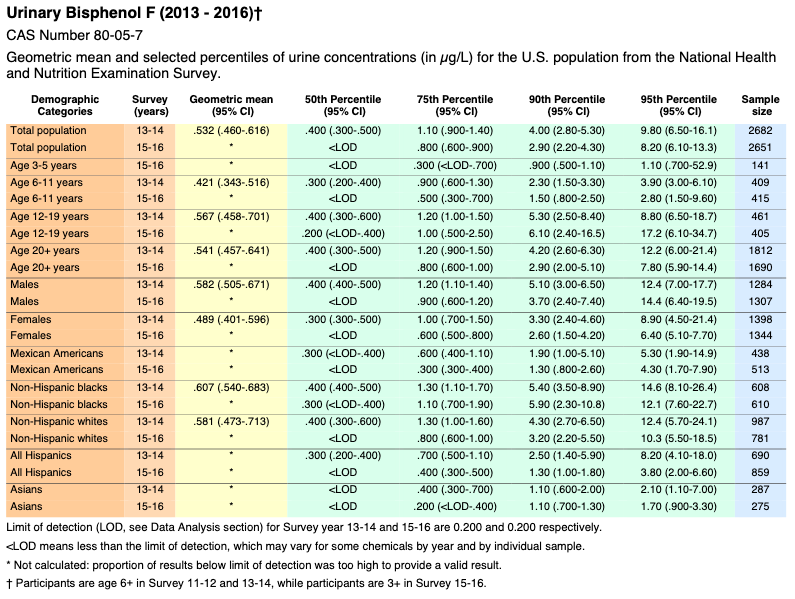
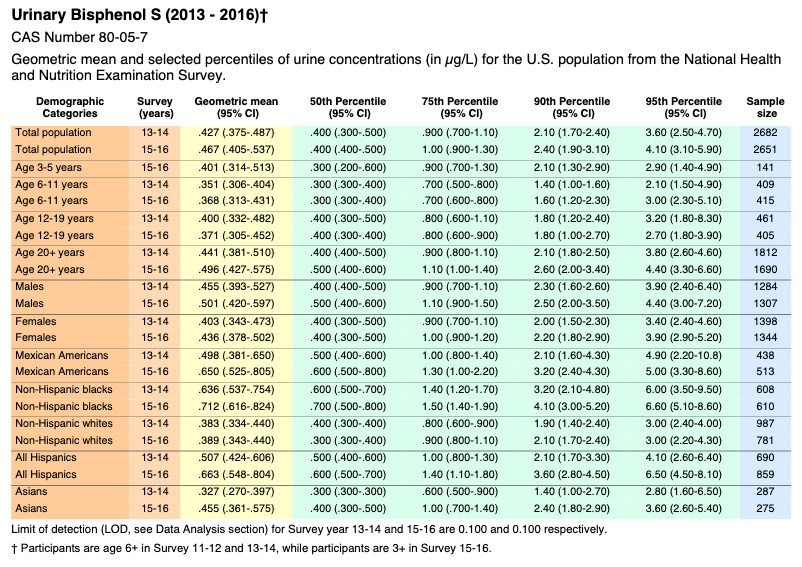
Another credible, but limited assessment from the National Health and Nutrition Examination Survey (NHANES), is excerpted in Appendix 1, and indicates a decreasing detection of BPA levels in humans tested, and a concomitant increase in BPF and BPS.
That parallels the relatively high concentrations in BPF and BPS in our trial serum specimens, but leaves the sources unknown and the results anomalous.
In addition, the measured changes in analogue compounds and main metabolite among the three legs were inconsistent with theorized changes and may reflect the effects of compounds other Plastic-derived chemicals than Bisphenol upon hsCRP inflammation measurement and/or unknown contamination sources in intervention food ingredients, meal preparation or subject environment e.g. PM2.5 levels.
Knowledge Gained
Using an n-of-1 design allowed current investigators to economically complete a novel experiment to search for a standard and easily employed biomarker for direct human evidence of harmful effects of Bisphenol A.
This is significant because regulatory decisions have been based on scientifically flawed government trials (Primarily two CLARITY studies) of a murine model incorrectly concluding that Bisphenol A is not harmful to humans.
Other studies incorrectly claim that BPA metabolites are not harmful, and that it is rapidly metabolized and excreted. Numerous published studies indicate that both claims are untrue. (Citations, Appendix 2)
What’s more, hundreds of other well-designed NIH and other academic studies which detail a wide variety of endocrine and epigenetic harms are unacceptable regulatory for consideration. (Citations, Appendix 2)
Finally, acceptance by the government and the governed population of harms from a toxic substance regulated bu the results of tests on mice and other non-human organisms ultimately required testing in human populations — just as is conducted for new pharmaceuticals.
The validity of current regulatory science makes it vital to recognize that 90 percent of promising new drugs fail to make it to market even after human trials. (Free article from Science blog here).
For that reason, developing a reliable and relatively inexpensive, and clinically acceptable biomarker — such as hsCRP– for BPA and other chemicals, will broaden the ease of human experimentation and widely acceptable data creation.
Moving forward
The most useful and economically practical first step would be an n-of-1 study using urine sampling and the principles outlined in the MedRxiv study:
- Identical meals/diet for each leg, with dosing of contaminated leg.
- Rigidly controlled test subject physical environment.
- Urinalysis of samples combined with serum.
- Additional valuable information can be gathered by expanding the number of potential biomarkers.
Appendix 1 – NHANES Data
Fourth National Report on Human Exposure to Environmental Chemicals
Updated Tables, March 2021
Geometric mean and selected percentiles of urine concentrations (in μg/L) for the U.S. population from the National Health and Nutrition Examination Survey.
Excerpted data. Selected full data tables follow
Volume One: NHANES 1999-2010
Bisphenol A
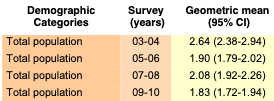
Bisaphenol F and S not monitored
Volume Two: NHANES 2011-2016
Bisphenol A

Bisphenol F
![]()
* Not calculated: proportion of results below limit of detection was too high to provide a valid result.
Bisphenol S

Selected full data tables
Volume One: NHANES 1999-2010
Biomonitoring Summary: https://www.cdc.gov/biomonitoring/BisphenolA_BiomonitoringSummary.htmlFactsheet: https://www.cdc.gov/biomonitoring/BisphenolA_FactSheet.html
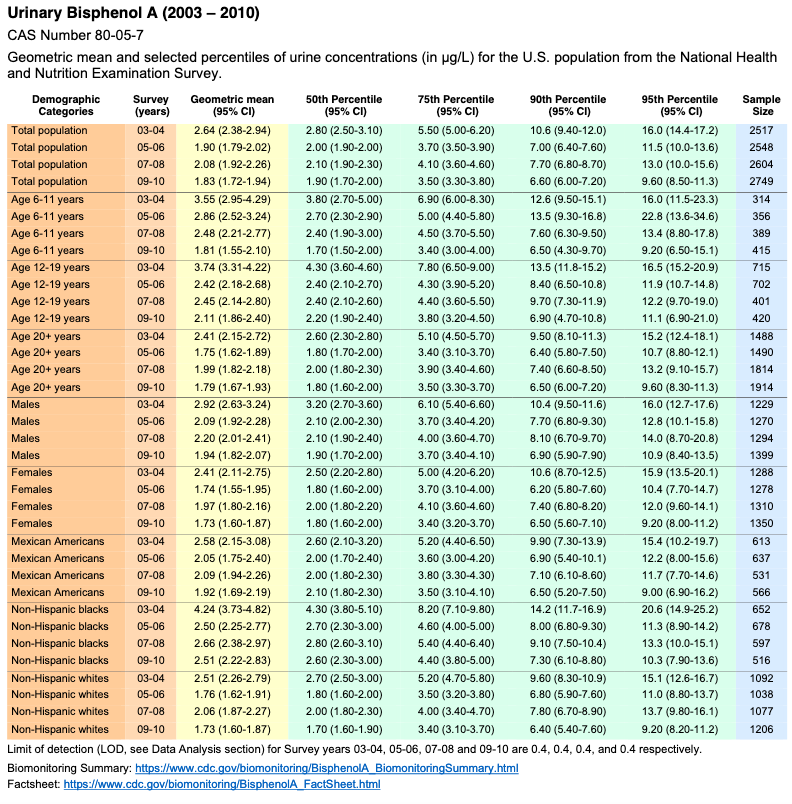
No monitoring data for Bisphenol F or Bisphenol S
Volume Two: NHANES 2011-2016
https://www.cdc.gov/exposurereport/pdf/FourthReport_UpdatedTables_Volume2_Mar2021-508.pdf
Biomonitoring Summary: https://www.cdc.gov/biomonitoring/BisphenolA_BiomonitoringSummary.htmlFactsheet: https://www.cdc.gov/biomonitoring/BisphenolA_FactSheet.html
Appendix 2 – Selected Citations
Measurement
- BPA: have flawed analytical techniques compromised risk assessments?
- A round robin approach to the analysis of bisphenol a (BPA) in human blood samples
- Regulatory and academic studies to derive reference values for human health: The case of bisphenol S (Many associated citations)
- Exposure to Triclosan and Bisphenol Analogues B, F, P, S and Z in Repeated Duplicate-Diet Solid Food Samples of Adults
Exposure Trends
- Dietary quality and bisphenols: trends in bisphenol A, F, and S exposure in relation to the Healthy Eating Index using representative data from the NHANES 2007–2016
- Urinary Concentrations of Bisphenol A and Three Other Bisphenols in Convenience Samples of U.S. Adults during 2000–2014
- Bisphenol A Data in NHANES Suggest Longer than Expected Half-Life, Substantial Nonfood Exposure, or Both
Metabolites
- Investigating the glucuronidation and sulfation pathways contribution and disposition kinetics of Bisphenol S and its metabolites using LC-MS/MS-based nonenzymatic hydrolysis method
- Repeated Exposure to 4-Methyl-2,4-bis(4-hydroxyphenyl)pent-1-ene (MBP), an Active Metabolite of Bisphenol A, Aggressively Stimulates Breast Cancer Cell Growth in an Estrogen Receptor β (ER β)-Dependent Manner
- Effects of Bisphenol A Metabolite 4-Methyl-2,4-bis(4-hydroxyphenyl)pent-1-ene on Lung Function and Type 2 Pulmonary Alveolar Epithelial Cell Growth
- 4-Methyl-2,4-bis(4-hydroxyphenyl)pent-1-ene (MBP) Targets Estrogen Receptor β, to Evoke the Resistance of Human Breast Cancer MCF-7 Cells to G-1, an Agonist for G Protein-Coupled Estrogen Receptor 1
Analogues & Effects
- Bisphenol A, Bisphenol F, and Bisphenol S: The Bad and the Ugly. Where Is the Good?
- Toxicity of bisphenol analogues on the reproductive, nervous, and immune systems, and their relationships to gut microbiome and metabolism: insights from a multi-species comparison
- Bisphenol A and its analogs: Do their metabolites have endocrine activity?
- From BPA to its analogues: Is it a safe journey?
- Bisphenol A and its Analogues: Human Exposure and Biological Effects-A Review
- BPA and BPA alternatives BPS, BPAF, and TMBPF, induce cytotoxicity and apoptosis in rat and human stem cells
- A targeted review on fate, occurrence, risk and health implications of bisphenol analogues
- Low-dose Bisphenol A and its analogues Bisphenol F and S activate estrogen receptor ß and slightly modulate genes in human gingival keratinocytes
- BPA Replacement Compounds: Current Status and Perspectives
- Disrupted metabolic pathways and potential human diseases induced by bisphenol S
- Bisphenol A exposure, interaction with genetic variants and colorectal cancer via mediating oxidative stress biomarkers
- Dietary quality and bisphenols: trends in bisphenol A, F, and S exposure in relation to the Healthy Eating Index using representative data from the NHANES 2007–2016
Monitoring and Trends
- Biomonitoring of occupational exposure to bisphenol A, bisphenol S and bisphenol F: A systematic review
- Exposure to Bisphenol A, Bisphenol F, and Bisphenol S in U.S. Adults and Children: The National Health and Nutrition Examination Survey 2013–2014
- Exposure to Bisphenol A, Bisphenol F, and Bisphenol S in U.S. Adults and Children: The National Health and Nutrition Examination Survey 2013–2014
- Bisphenol A and its Analogues: Human Exposure and Biological Effects-A Review
- Occurrence, toxicity and endocrine disrupting potential of Bisphenol-B and Bisphenol-F: A mini-review
Miscellaneous
- Trends in clinical success rates and therapeutic focus
- Estrogenic activity of capsule coffee using the VM7Luc4E2 assay
- Effect of common consumer washing methods on bisphenol A release in tritan drinking bottles
- Study on bisphenol F, a bisphenol A analogue, at a dairy company: Health hazard and risk assessment
- Bisphenol A and Metabolites in Meat and Meat Products: Occurrence, Toxicity, and Recent Development in Analytical Methods
- The occurrence of bisphenol compounds in animal feed plastic packaging and migration into feed
- Deposition, depletion, and potential bioaccumulation of bisphenol F in eggs of laying hens after consumption of contaminated feed